 Recently, my family acquired a gecko.
A crested gecko, to be specific. Our little guy started life as a classroom pet. He came in a rather sad, small Walmart Pet Department-level terrarium. We set out to create a lavish new jungle habitat for him, and he will soon be moving into this splendid home.
His name is Echo. His new home will be named, naturally, the Echo Chamber.
Crested geckos have relatively tight temperature and humidity ranges. The previous terrarium had an analog digital meter on a suction cup but we decided to geek out on the new setup. I’ve got a Raspberry Pi (an old model 3) with a DHT22 probe in the terrarium taking temperature and humidity measurements every 5 seconds.
Each reading is dumped into a Postgresql database, using the AdaFruit DHT22 driver. This code is easily googleable/bingable/duckable so I won’t bother pasting it here. But this was the first time I’ve really worked with Grafana, and it’s been a lot of fun.
Chiefly, this has been because Grafana is astonishingly easy to use. After a simple install (adding the Grafana repo and using apt to instal grafana-server), I started the server, logged in, and began creating my first dashboard. No .conf file to start with and I never did look at any documentation. Starting from zero knowledge other than the name of the product, this took me less than an hour to create:
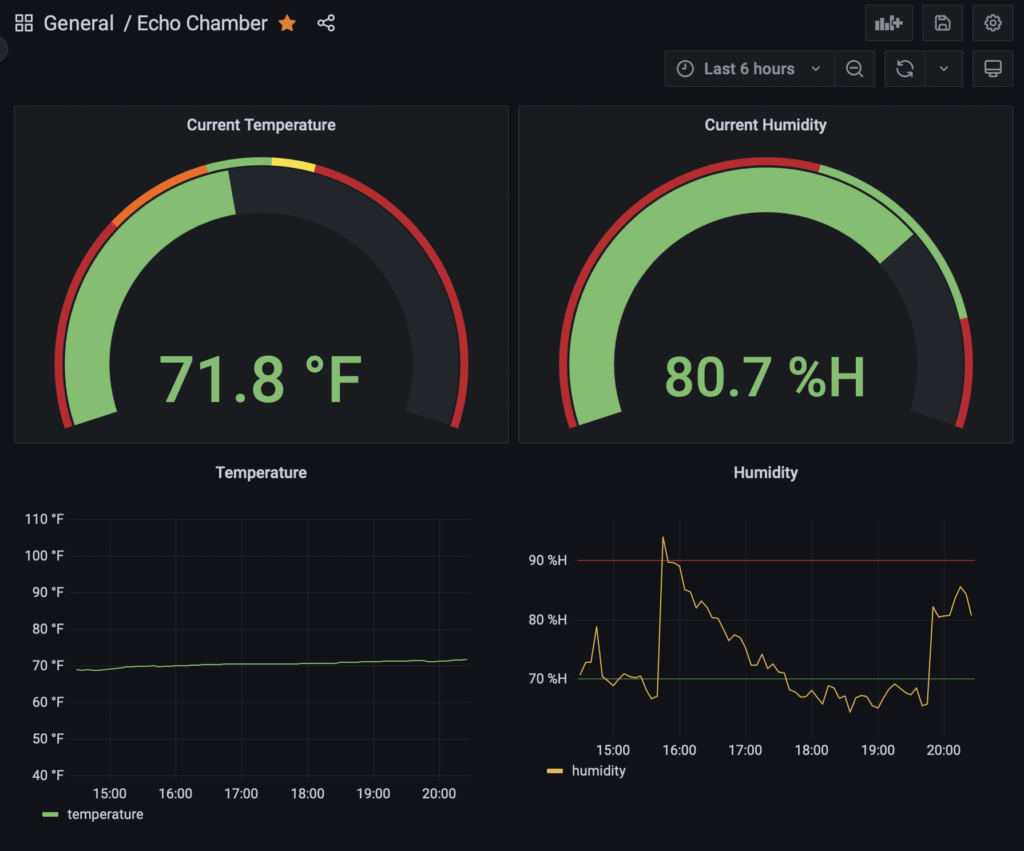
It’s astonishing how simple this is in Grafana. After entering my Postgresql DB credentials, Grafana did all the heavy lifting of selecting data.
The above is a simple dashboard with four panels. The bottom two are simple time series graphs, and these were very easy to create. There is a rich palette of options, but even out of the box the defaults make a perfectly serviceable graph. The top two panels are gauges and were also simple to configure, with custom warning thresholds. This is a desktop screenshot but Grafana is very mobile-friendly.
It’s also quite pleasantly Raspberry Pi-friendly. Even if everyone in the house is simultaneously watching it in on separate devices, the Pi is only using about 100-120MB of RAM. That’s Postgres, NGINX, Grafana, the poller (a Python script), and normal background services.
I’m just scratching the surface here with Grafana – for example, we’re going to be setting up monitoring and alerts using the platform as well. It’s a fun product, incredibly easy to use, and produces awesome dashboards. Check it out!
Related Posts:
I've Got a Big Crush on the Little PicoCalc From clockworkPi! Lots Cheaper Than a Boring Calculator...
Little Machines in Big Datacenters: Where to Host Your Raspberry Pi
Let's Try Out RPiServers.com! Raspberry Pi in the Cloud
Raspberry Pi Photo Frame: The Major Slideshow Options + Thermal Monitoring Script
How to Turn Off the HDMI Monitor on Your Raspberry Pi 5. It's Not As Easy as You Might Think
Here Comes the Raspberry Pi 5
Raindog308 is a longtime LowEndTalk community administrator, technical writer, and self-described techno polymath. With deep roots in the *nix world, he has a passion for systems both modern and vintage, ranging from Unix, Perl, Python, and Golang to shell scripting and mainframe-era operating systems like MVS. He’s equally comfortable with relational database systems, having spent years working with Oracle, PostgreSQL, and MySQL.
As an avid user of LowEndBox providers, Raindog runs an empire of LEBs, from tiny boxes for VPNs, to mid-sized instances for application hosting, and heavyweight servers for data storage and complex databases. He brings both technical rigor and real-world experience to every piece he writes.
Beyond the command line, Raindog is a lover of German Shepherds, high-quality knives, target shooting, theology, tabletop RPGs, and hiking in deep, quiet forests.
His goal with every article is to help users, from beginners to seasoned sysadmins, get more value, performance, and enjoyment out of their infrastructure.
You can find him daily in the forums at LowEndTalk under the handle @raindog308.


Perfect. If you can get kids involved in real life activities, you are making the world a better place for all.