Nagios is one of the most easy, expandable and trustworthy ways to monitor the status of your server(s). It is highly configurable and even lets you write your own plugins in whatever language you want.
This article will focus on installing nagios on a single server (and monitor just that server). In order to monitor more than just the nagios server, see my ‘Remote server monitoring with Nagios’ article. In the context of that article, this will be the nagios server.
This article also assumes you use a recent version of Ubuntu/Debian, but could very well work on other distributions as well. If there is popular demand for, say, a CentOS-tested version of this guide I will write that.
Getting Nagios up and running
Getting Nagios up and running in itself is actually pretty easy. Not that configuring it is that hard, but you do need to know where to look. Let’s first get Nagios up and running and then configure it properly so everything will work.
Before we start, we need to remove sendmail. Nagios pulls in Postfix as a dependency. On OpenVZ’s Ubuntu 12.04 x64 LTS template, sendmail is installed by default. Run this to remove it:
sudo apt-get purge sendmail sendmail-base sendmail-bin sendmail-cf sendmail-doc
Also, make sure the system is up-to-date, otherwise apt-get may not find nagios3 and nagios3-cgi:
sudo apt-get update; sudo apt-get dist-upgrade
Once that’s all done, we can now start by installing Nagios:
sudo apt-get install -y nagios3 nagios3-cgi
This will list Postfix as a dependency. You will be asked to configure it. Select ‘Internet Site’ and press ENTER.

Then set the proper system mail name and press ENTER again.

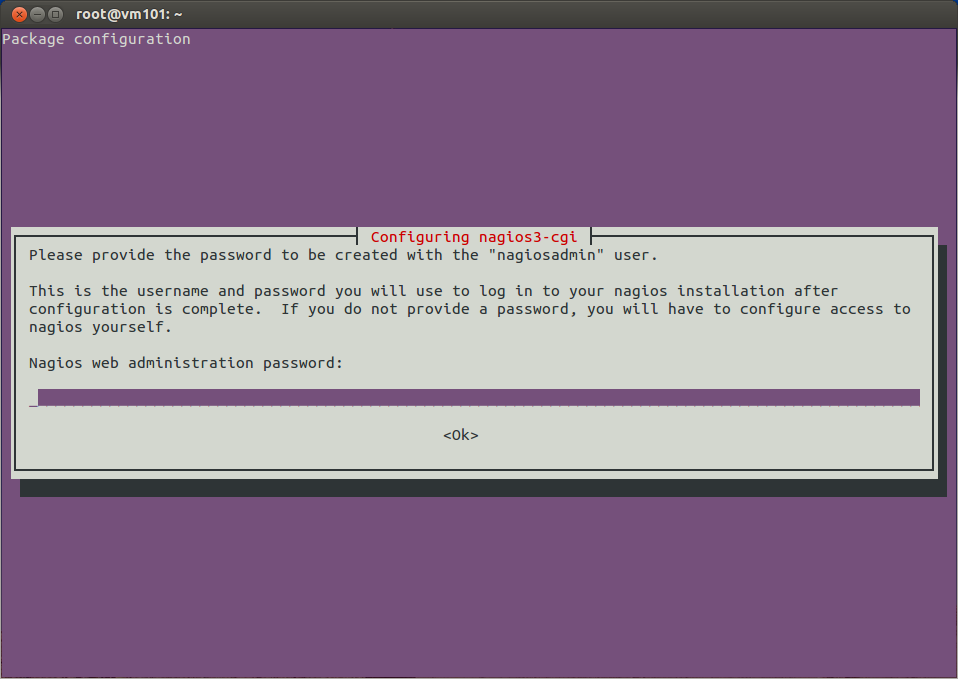
Finally, it should ask for your nagios administrator password. Fill one out and confirm it.
That’s it! You’ve now got Nagios up and running. If you go to http://example.net/nagios3 and log in with ‘nagiosadmin’ and the password you just entered, you’ll see the Nagios Web Interface. If you click ‘Services’ in the left-hand menu, you’ll see localhost listed and some checks on ‘OK’ and some checks on ‘Pending’. Eventually, they should all become green and ‘OK’. Nagios just needs some time for the initial checks.
Getting it all working
You’re done, but you’re not done. Nagios may now list the initial check, but some things are still broken. For example, you cannot plan maintenance yet.
We start by telling nagios to check for external or CGI commands. You perform a CGI command by, for example, scheduling maintenance via the Nagios Web Interface. We have to edit the main nagios config for this, so:
sudo vim /etc/nagios3/nagios.cfg
Look for ‘check_external_commands’ and enable if by changing ‘check_external_commands=0’ to:
check_external_commands=1
Next we need to add the www-data user to the nagios group, so it has permissions to certain files. Open up the groups file:
sudo vim /etc/group
And look for this line:
nagios:x:114
And change it to:
nagios:x:114:www-data
We’ve now added www-data to the nagios group.
The last step for getting Nagios to run is giving execute permissions to one file and one directory. We need to set the executable bit on both the file and the directory because if we just set it on the file, it won’t work. Let’s start with the directory:
sudo chmod g+x /var/lib/nagios3
And then the file:
sudo chmod g+x /var/lib/nagios3/rw
You’ve just made sure CGI commands actually work, not that nagios just listens to them.
We close up by restarting nagios and apache so all new settings are available:
sudo service nagios3 restart
sudo service apache2 restart
And we’re done setting up nagios!
Defining a contact
Now that we’ve got nagios up and running and have our initial checks for localhost in place, let’s make sure we do get e-mail when something goes wrong.
Open up the contacts configuration file (sudo vim /etc/nagios3/conf.d/contacts_nagios2.cfg) and look for a code block like this:
define contact{
contact_name root
alias Root
service_notification_period 24×7
host_notification_period 24×7
service_notification_options w,u,c,r
host_notification_options d,r
service_notification_commands notify-service-by-email
host_notification_commands notify-host-by-email
email root@localhost
}
Let’s explain what you’re seeing here and how you’re going to be receiving e-mail.
The first two lines (contact_name and alias) are identifiers for this contact. You can name the contact whatever you want. Just stay clear of spaces in the contact_name. Feel free to use them in the alias.
The next two lines refer to a time period from /etc/nagios3/conf.d/timeperiod_nagios2.cfg. In that file, several time periods are configured per day. Check the file out to see which time periods are available. We’re using the timeperiod_name as listed in the timeperiods file in our contacts file:
service_notification_period 24×7
host_notification_period 24×7
Those two lines tell us during which time period to send notifications for service and host problems respectively, but only to this contact. You probably see the flexibility we’ve got here.
Next we look at the type of service/host states we will be receiving notifications for:
service_notification_options w,u,c,r
host_notification_options d,r
This is set to send notifications when a service is WARNING (w), UNKOWN (u), CRITICAL (c) or when it recovers from a problem (r). For hosts, we get notified when they are DOWN (d) or when it recovers from a problem (r). You can specify to receive no notifications at all for a certain type (service or host) by putting an ‘n’ there.
The next two lines refer to commands defined in the commands file /etc/nagios3/commands.cfg. Open up this file and look around a bit. In our contacts configuration it looks like this:
service_notification_commands notify-service-by-email
host_notification_commands notify-host-by-email
When a service notification is going to be sent, it uses the command defined in notify-service-by-email and sends out the e-mail. Same goes for host notifications. Feel free to customize the e-mail in the commands file.
The last line of this configuration file is what we’ve actually been looking for. The e-mail setting:
email root@localhost
This is where you can define your own e-mail address. When done, reload nagios:
sudo service nagios3 reload
And you should be receiving e-mail notifications when a problem occurs.
A closing word
There’s a lot more to tell about nagios, but you’ve probably already noticed that. We’ve referred to several files which we’ve not handled in detail. The most important next thing is monitoring remote servers and defining checks. For that, I recommend you read my article ‘Remote server monitoring with Nagios’ which is a follow-up to this one. In that article, we’re going to add a remote server and define a host check. The host check definition explained there can also be used on localhost.
Related Posts:
Are Tutorials Dead?
Have You Checked Out RackNerd's TikTok Channel? Video Content That Brings Web Hosting Mainstream!
From Oracle Cloud to TOR to Telegram: Check Out LowEndTalk Tutorials!
LowEndBox BUSTED for Dealing in Mind Expanding Substances
Guest Post: Top Five Reasons Why Most Businesses Either Fail or Stay Stagnant by Dustin B. Cisneros,...
How To Compile The 3 Items Needed To Begin MIT’s Free Xv6 Online Operating System Course!
Maarten Kossen served as the administrator of LowEndBox from 2013 to 2015, playing a key role in guiding the platform during a critical phase of its growth. During his tenure, Maarten introduced numerous improvements, helped shape editorial direction, and contributed to the evolution of LowEndBox as both a resource and a community hub for budget-conscious hosting users.
With a deep understanding of web hosting, server management, and open-source infrastructure, Maarten brought fresh ideas and steady leadership to the site, bridging the gap between the original vision of LowEndAdmin and the future of the platform.
Today, Maarten remains an active and valued member of the LowEndTalk community (@mpkossen), continuing to share his experience, engage in discussions, and support the broader LowEnd ecosystem.


This is Maartens first article for LowEndBox! Thank you very much for writing such a good article. Hopefully more content which isn’t offers will begin to be regularly posted.
Well written and easy to follow. Good job.
Great work! 😀
great work, i will so gonna use this!!!
Thanks Maarten! Gonna try this out for sure!
How can I submit tutorials to LowEndBox? I’m thinking of writing one on how to setup SoftEther using a Local Bridge. I’ve got several requests for this in my inbox, might as well submit it to LowEndBox 🙂
Thanks! You could contact Liam and/or Chief.
Sure, would be great if you could write something. You should get in touch with Liam, liam[at]lowendbox.com. 😉
Thanks for the guide! Just tried it out and it worked well. The only issue that I faced was that nagios didn’t have rights to use the ping command, but that was solved by using the command # chmod u+s /bin/ping
Thanks!
Hmm, interesting. Never experienced that. Thanks for the feedback, though!
Thanks for the useful guide and welcome Maarten, just want to see more good jobs.
i would like to see the centos version 😀
Great work! Thank you for the article!
This is a simple yet comprehensive article. Thanks @Maarten Kossen.
Nice, thanks for the article, appreciated.
Great article and great to see changes here, such as guides.
Great job. And don’t forget to include Centos tutorials. 🙂
Thanks! Will do from now on (although my next article isn’t written for CentOS yet).
Hi , please write one for centos too 🙂 tx
Thanks guys! For any new guides I write, I’ll try to make them hybrid (both Ubuntu and CentOS).
Great article!
You should proceed with this and make tutorials of how to properly use and abuse check_mk, pagerduty and nagvis.
Thanks much for doing this. If you’re taking requests for further ones, I’d be especially happy to see one about setting up VPN’s to secure connections between LEB’s. I know about SSH tunnelling but it’s a bit flaky.
Thanks for the tip! I’ve added it to my list of possible subjects!
This is a nice tutorial. I only mis the service part, but you mention explicitly that this tutorial only covers installing and the local nagios server. I do like how you also explain each step. Not just how to do it but also what and why you do something, that is good writing.
I hope that in the next part you go in to NRPE, and not try to do weird ssh tunneling or other strange checks ;). Some basic website monitoring (check_http), cpu load, disk space, apt updates, maybe process checking (apache and such), maybe mysql monitoring, just a few tips you can touch on.
Still, thumbs up from me, like your style!
Thanks!
Yes, next time I will go into NRPE. Actually, I wrote my next article first and then I wrote this one. Which is why the service part is missing here. I’ll go into detail about that in the next article.
Yes, would like to know more about NRPE. Specifically, using a LEB to run Nagoios monitor to track several client machines….thanks for great stuff!
Nice tutorial.
Can I use Nginx instead of Apache?
and what if port 80 is used, can it automatically detects it and change to other port?