
Have you ever wished you could monitor the performance of your server after the fact? Or did you ever want to get some statistics of your server, about it’s performance and the amount of resources used? Look no further: Munin is here!
Munin is a resource monitoring tool that helps you monitor server performance and analyze problems after they happened. Munin uses RRDtools, a data logging and graphing system, for storing and displaying logged data. It’s plug and play and has over 500 plugins available. It’s open source and freely available. In addition to all that, it has networking capabilities so a monitoring master can hold the data for all nodes in a cluster (more on that next week).
So, I’m going to show you how to set up and configure Munin on a single node and check those graphs. As usual, written for and tested on both CentOS and Ubuntu.
Installing Munin on CentOS
I’ve assumed the EPEL repository is present.
To install Munin, simply run:
sudo yum install munin
Depending on what you already have installed, this could pull in a bunch of dependencies, one of them being munin-node. Once the install is complete, Munin is already running and collecting data.
To have Munin automatically run when CentOS boots, run:
sudo chkconfig munin-node on
And you should be good. Go to the ‘Configure Munin’ section to check out how to tweak the configuration.
Installing Munin on Ubuntu
To install Munin, simple run:
sudo apt-get install munin
Depending on what you already have installed, this could pull in a bunch of dependencies, one of them being munin-node. Once the install is complete, Munin is already running and collecting data. Go to the ‘Configure Munin’ section to check out how to tweak the configuration.
Configuring Munin
So, with Munin already up and running, what is there to configure? Well, I usually change just one thing: the hostname in the munin configuration. Open up /etc/munin/munin.conf and look for a line like this:
[localhost.localdomain]
Change that line to match your hostname:
[hostname.example.net]
And restart munin-node:
CentOS
sudo /etc/init.d/munin-node restart
Ubuntu
sudo service munin-node restart
Munin should now write the proper hostname in the logs.
There’s a lot more configuration options here, amongst which those needed to get a clustered configuration (one node containing all the data and charts for all your servers). If Munin is chewing up too much resources, edit the following setting:
#max_processes 16
Enable it by removing the comment and change the value to 8 or 4 (or even 2):
max_processes 8
Then, restart munin-node again.
Basically, that’s all that’s needed for a working Munin installation! Easy, wasn’t it?
See the results
When you’ve just installed Munin, there’s not too much data to see yet. So let it be for at least a day, preferably more, before you check the results. When you’ve done so ( you’re probably still reading, so chances are you’re going to try this anyway 😉 ), there’s two options to see the munin results:
- From your browser
- SFTP to the server with a file browser and open the file
1. Browser
Munin has one nasty habbit: it pulls in Apache as a dependency. For die-hards out there, just replace it with nginx. I’ve not done so for this example. Munin is available at http://hostname.example.net/munin. On CentOS, it requires a username and password. On Ubuntu, it requires an IP whitelist (or username and password). I’m going to show you how to enable browser access for both.
CentOS
On CentOS, all you need to do it generate a username and password. To do that, run:
sudo htpasswd /etc/munin/munin-htpasswd mpkossen
Your username is the second argument (mpkossen is my case). This could first ask you for your sudo password and then for a new password (twice). As usual, pick a strong password here.
If you now surf to http://hostname.example.net/munin you can fill in that username and password and you should be able to see the Munin interface. Click on your hostname and you should see stats and graphs.
Ubuntu
On Ubuntu, it’s a tad more complicated. You need to disable the IP limit and enable Basic Auth before creating a username and password. Open up /etc/munin/apache.conf (sudo vim /etc/munin/apache.conf) and look for this block (at the top of the file):
Order allow,deny
Allow from localhost 127.0.0.0/8 ::1
Options None# This file can be used as a .htaccess file, or a part of your apache
# config file.
#
# For the .htaccess file option to work the munin www directory
# (/var/cache/munin/www) must have “AllowOverride all” or something
# close to that set.
## AuthUserFile /etc/munin/munin-htpasswd
# AuthName “Munin”
# AuthType Basic
# require valid-user
Change that block to match the following:
# Order allow,deny
# Allow from localhost 127.0.0.0/8 ::1
Options None# This file can be used as a .htaccess file, or a part of your apache
# config file.
#
# For the .htaccess file option to work the munin www directory
# (/var/cache/munin/www) must have “AllowOverride all” or something
# close to that set.
#AuthUserFile /etc/munin/munin-htpasswd
AuthName “Munin”
AuthType Basic
require valid-user
As you can see, I commented the ‘Order’ and ‘Allow’ statements so the IP limit has been lifted. I enabled Basic Auth, so you should be asked for a username and password from now on. Restart Apache to apply these settings:
sudo service apache2 restart
Finally, let’s generate that username and password:
sudo htpasswd -c /etc/munin/munin-htpasswd mpkossen
Your username is the second argument (mpkossen is my case). The -c indicates the htpasswd file needs to be created. Contrary to CentOS, the file doesn’t exist on Ubuntu be default. This could first ask you for your sudo password and then for a new password (twice). As usual, pick a strong password here.
If you now surf to http://hostname.example.net/munin you can fill in that username and password and you should be able to see the Munin interface. Click on your hostname and you should see stats and graphs.
2. SFTP
I’m not sure how to do this on Windows or OS X, but on Ubuntu you can just SFTP into a server from Nautilus and browse everything. Munin stores it’s HTML in /var/cache/munin/www. If you open your server in Nautilus (type CTRL + L and put sftp://hostname.example.net in you location bar) and go to that location, you can just double click the ‘index.html’ and it should pop up in your browser. Depending on the network speed, the browser can hang for a second or so. Once it’s loaded, you should see a whole bunch of graphs for various parts of your system.
If you can’t go there with your browser, a poor man’s solution is to SFTP the files back to your PC and open them there. Then again, you would need to do that every time you want updated charts.
For example, this is the memory graph of one of my machines:
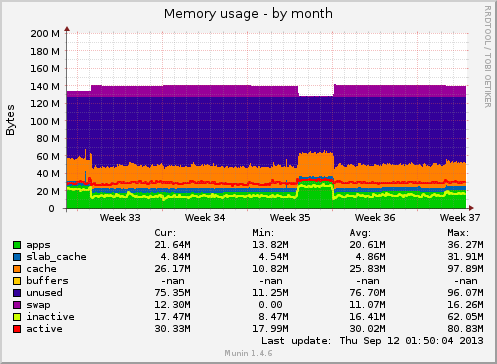
Well, that’s it! You can now monitor your server performance after the fact and keep an eye on things even when you’re not at your PC!
Final notes on Munin
That’s it for Munin this week. Next week, I’ll show you how to set up one master node where all your other node’s data is being pulled to. In a future guide, I may dive into Munin’s plugin system so you can unleash the full power of Munin on your server park!
Up next week: Munin amass, all your server charts in one place!
Related Posts:
Are Tutorials Dead?
Have You Checked Out RackNerd's TikTok Channel? Video Content That Brings Web Hosting Mainstream!
From Oracle Cloud to TOR to Telegram: Check Out LowEndTalk Tutorials!
LowEndBox BUSTED for Dealing in Mind Expanding Substances
Guest Post: Top Five Reasons Why Most Businesses Either Fail or Stay Stagnant by Dustin B. Cisneros,...
How To Compile The 3 Items Needed To Begin MIT’s Free Xv6 Online Operating System Course!
Maarten Kossen served as the administrator of LowEndBox from 2013 to 2015, playing a key role in guiding the platform during a critical phase of its growth. During his tenure, Maarten introduced numerous improvements, helped shape editorial direction, and contributed to the evolution of LowEndBox as both a resource and a community hub for budget-conscious hosting users.
With a deep understanding of web hosting, server management, and open-source infrastructure, Maarten brought fresh ideas and steady leadership to the site, bridging the gap between the original vision of LowEndAdmin and the future of the platform.
Today, Maarten remains an active and valued member of the LowEndTalk community (@mpkossen), continuing to share his experience, engage in discussions, and support the broader LowEnd ecosystem.


Please be aware the munin can be superheavy on disk at times. We are using it to monitor only some 30 servers and on a SSD server but it still throws 500 errors every second refresh…
Also, hosted munin servers for other people, with only a few servers are very heavy on disk. If you have many servers to watch, make sure you only generate the graphs you need.
Second this. Tried it and also had a few users running it that used quite a lot of disks. Nice tutorial. Using Observium right now though for some internal stuff.
I’m planning to do an observium tutorial in the near future 🙂
But indeed, Munin can be heavy on resources. It depends on logfiles and writes a lot itself as well. If a server is quite busy, it has effect on Munin’s performance.
Is Observium easier on resources under heavy loads?
Will I able to see what caused high ram usage, high load and what type of activities in the past 24 hours with munin for all of my servers?
No, not specific processes.
thanks sir..
nice tutor
FYI – Ubuntu Server 12.10 requires an extra line in the apache2.conf
ScriptAlias /cgi-bin /usr/lib/cgi-binApparently this directive is only missing on 12.10 by default.
Thanks for letting everybody know 🙂 I tested everything on 12.04.