Our community has a tendency to want to monitor just about everything. Even a $9.95 per year ultra LowEndBox.
They need to know if they’re getting 99.9999% uptime or 99.999% uptime. That’s a big difference for an idling server.
In fact, they usually use one of those cheap $9.95 per year servers to run their monitoring agent on to monitor their other $9.95 servers.
Basically, there’s a whole process here…
While uptime monitoring may seem like a stupid simple task that just about any tool could accomplish — wouldn’t you still want the best tool for your job? I would.
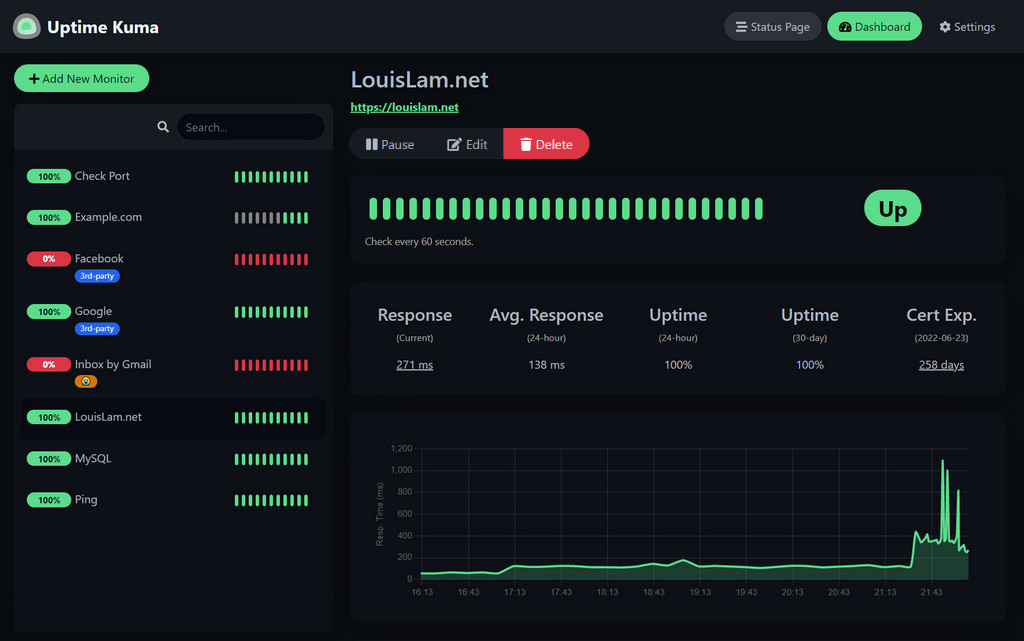
That’s why I use Uptime Kuma:

It’s a sleek and simple, free and open source, uptime monitoring tool that allows you to easily monitor your applications and receive alerts.
My previous complaint about uptime monitoring tools is they all seemed incredibly clunky. Like they were almost trying to do too much.
I don’t need 1,000 features in my monitoring tool. I just need to be able to sufficiently monitor my servers. Preferably for as cheap, or as free, as possible.
That said, there’s not much you could ask for in an uptime monitoring tool that Uptime Kuma doesn’t deliver on.
Everything just works — and it can be ran on just about any idler you have.
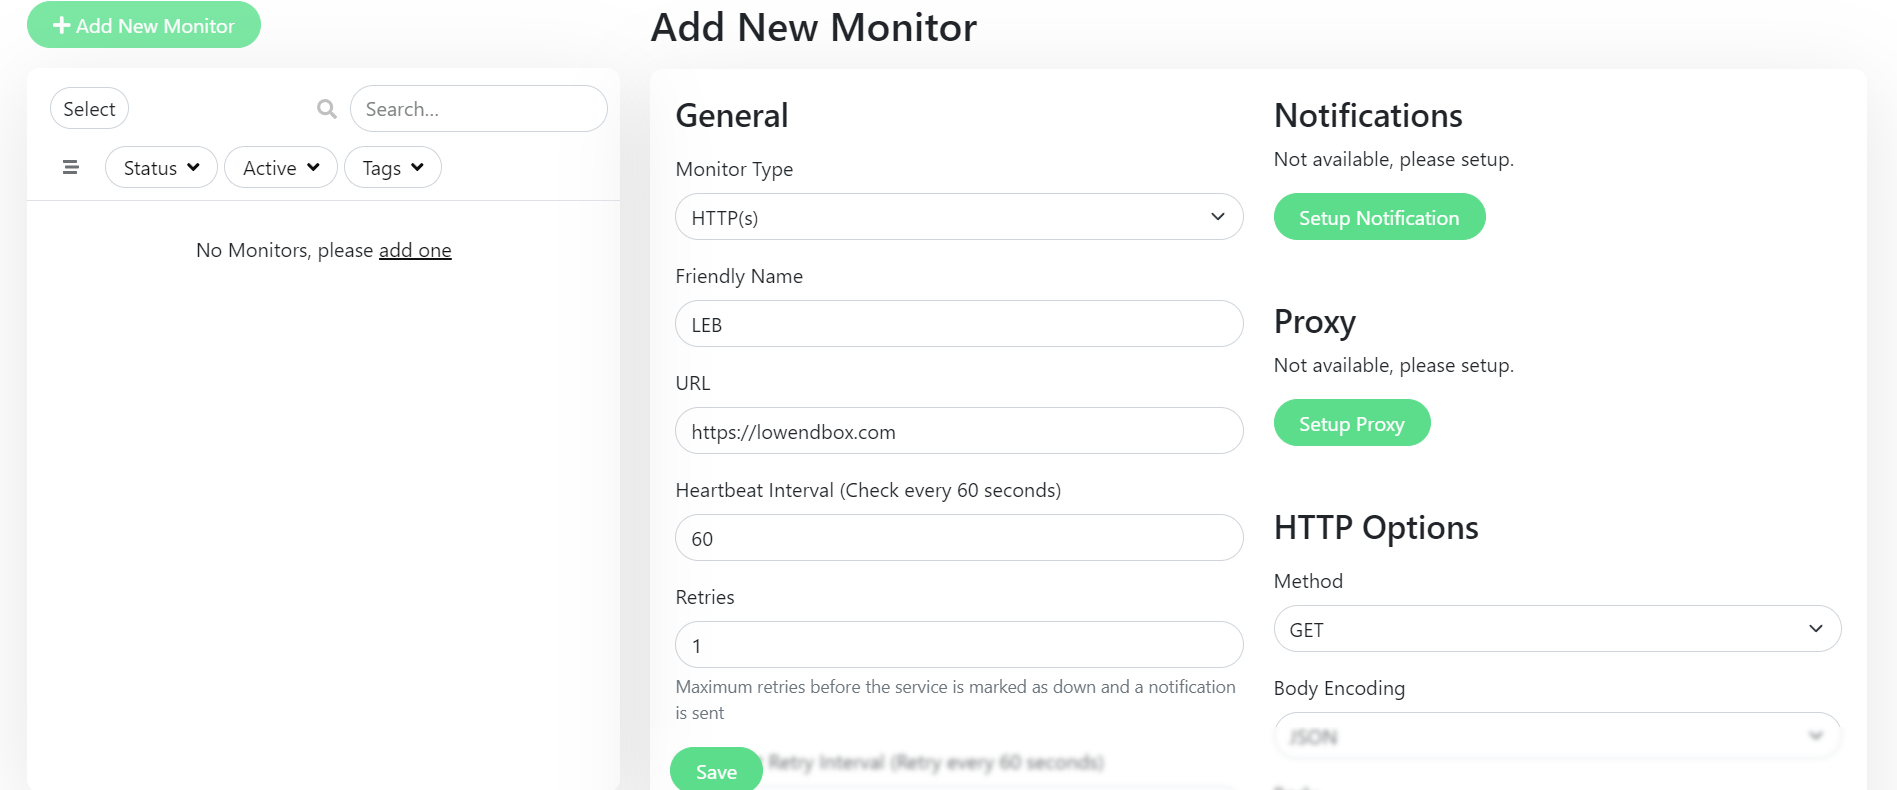
Anyone could figure out how to use Uptime Kuma within 2 minutes without having to ready any documentation. It’s the definition of point and click:

To set up a new monitor, you just need to select the individual monitoring settings, such as proxy, or no proxy. Notifications or no notifications. The type of monitor, and so on.
Then click “save” and you’re in business. Couldn’t be any more simple.
You can even try a live demo right here.
Officially, they advertise the following features:
- Monitoring uptime for HTTP(s) / TCP / HTTP(s) Keyword / HTTP(s) Json Query / Ping / DNS Record / Push / Steam Game Server / Docker Containers
- Fancy, Reactive, Fast UI/UX
- Notifications via Telegram, Discord, Gotify, Slack, Pushover, Email (SMTP), and 90+ notification services, click here for the full list
- 20-second intervals
- Multi Languages
- Multiple status pages
- Map status pages to specific domains
- Ping chart
- Certificate info
- Proxy support
- 2FA support
And they certainly deliver on all of them.
Interested in giving Uptime Kuma a spin? Here’s how:
How To Install Uptime Kuma
Uptime Kuma can be installed with Docker, just run the following command:
docker run -d --restart=always -p 3001:3001 -v uptime-kuma:/app/data --name uptime-kuma louislam/uptime-kuma:1If you’re interested in a more persistent environment, you can use Docker Compose with the following template:
version: '3.8'
services:
uptime-kuma:
image: louislam/uptime-kuma:1
container_name: uptime-kuma
volumes:
- uptime-kuma:/app/data
ports:
- "3001:3001" # <Host Port>:<Container Port>
restart: always
volumes:
uptime-kuma:
Then run:
docker compose up -d
You can click here to view Uptime Kuma’s GitHub for more information on installation and customization.


any lightweight http server to act as a client?